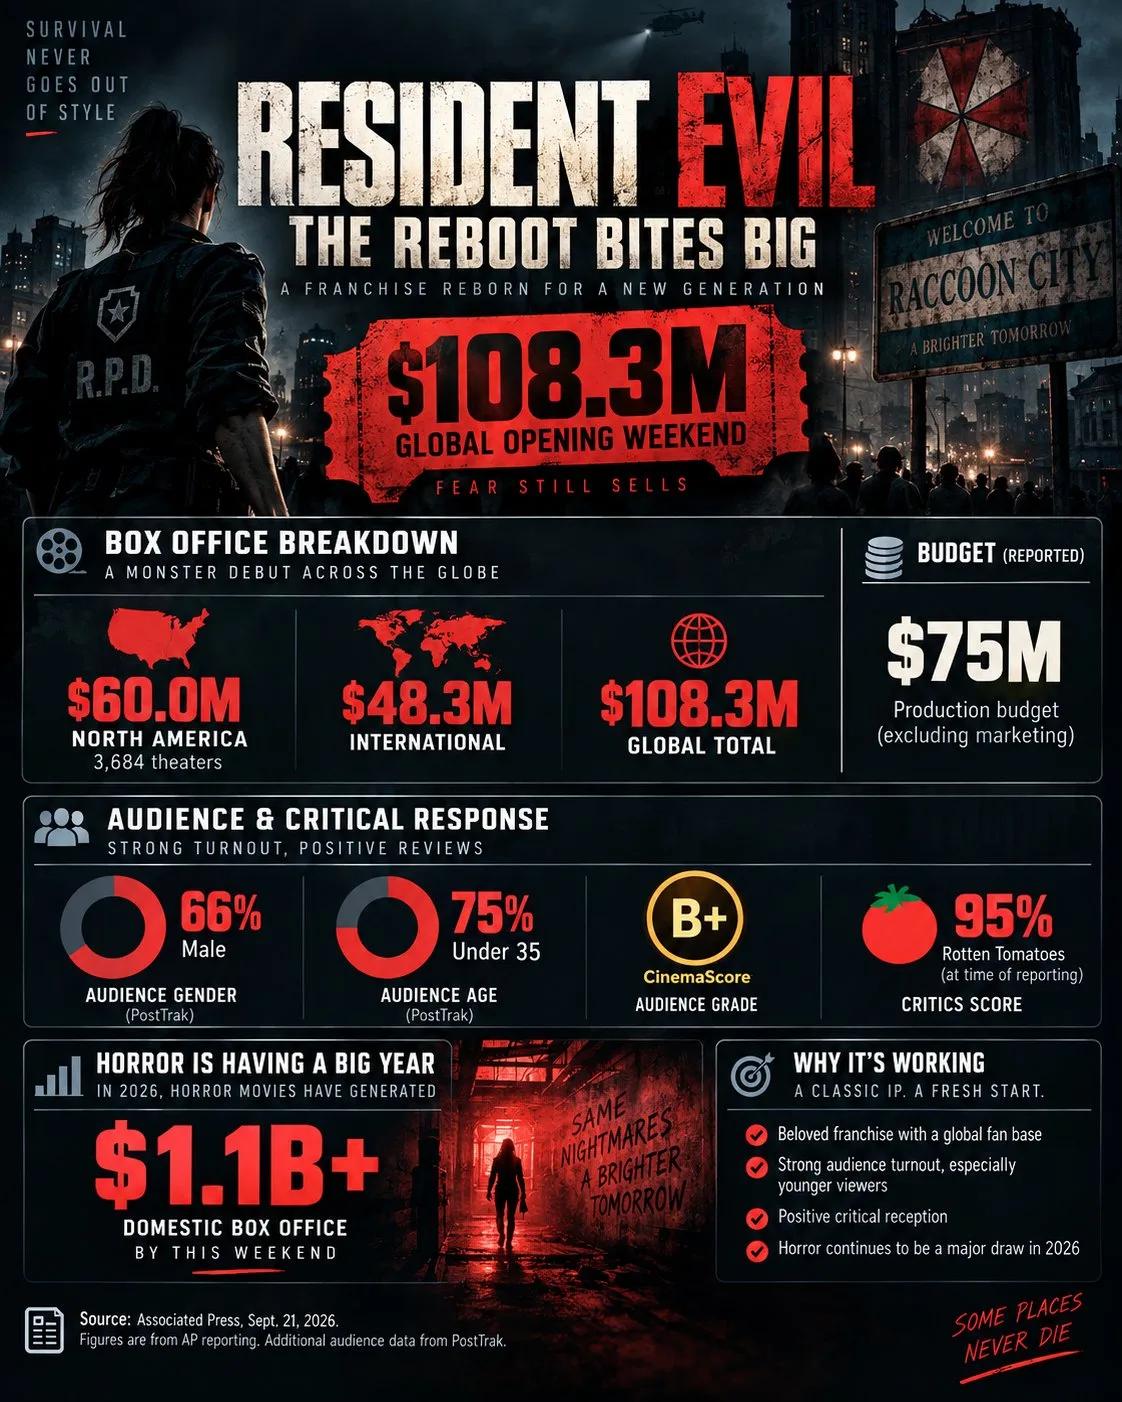


images · editorial layout · infographic generation
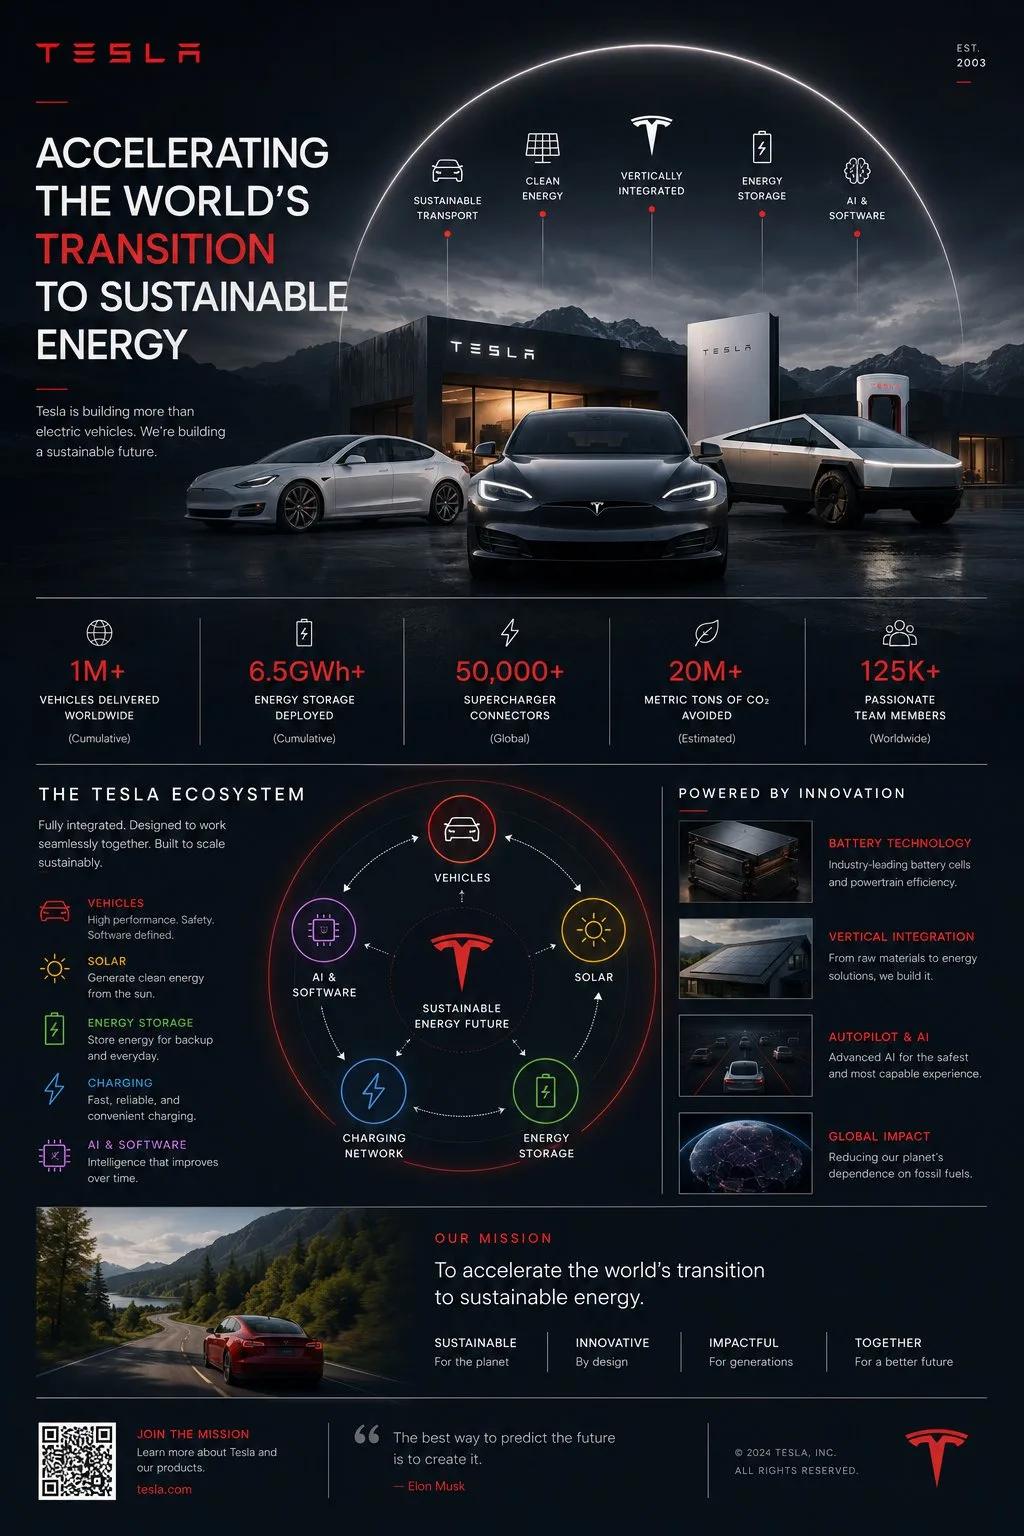
For TOPIC, choose modules by maximizing: FIT(module) = 0.30 * explanatory_power + 0.22 * topic_relevance + 0.18 * visual_clarity + 0.14 * comparison_value + 0.10 * editorial_readability + 0.06 * aesthetic_cohesion Possible modules: - map - timeline - ranked table - category cards - methodology box - anatomy callout - process diagram - matrix chart - flow pipeline - network diagram - scatter/radar comparison - case-study cards - source footer Only include modules whose FIT score exceeds threshold. Then order the chosen modules by narrative logic: HOOK → EXPLAINER → METHOD → METRICS → RESULTS → NOTES
Related prompts